Logger
Logging from actions
Every action will be passed a logger object in the incoming arguments. The logger conforms to the logger API and will output log statements viewable in Gadget's Logs.
Logging from HTTP routes
Every HTTP route will be passed a request.logger object on the incoming request object which can be used during the request to write logs. The logger adheres to the logger API and displays log statements in Gadget's Logs.
Logging from React Router and Remix loaders
When using React Router or Remix in framework mode, your loader functions have access to a logger object through the context parameter. This logger is the same structured logger available in Gadget actions and HTTP routes.
console.log
Gadget supports console.log statements for logging in your application and will show console.log messages at the info log level.
Using the structured logger object is recommended over using console.log for better performance, and to allow Gadget to add more context to your log messages.
logger API
Log messages are sent to the logger by calling one of the logging methods with an optional structured data object and a string message.
The default log levels (and associated log functions) are trace, debug, info, warn, error, and fatal.
The passed logger object is an instance of a pino.Logger managed by the Gadget platform. View the Pino logger docs for full API documentation.
Passing structured data
An object can optionally be supplied as the first parameter to log messages. Each key and value of the object is stringified and written to your application's logs as JSON.
Log calls at any level can also pass Error objects to get an easy-to-digest log entry in the Log Viewer for the error, including its stack trace and any other associated details. To log Error objects, pass the object at the error key of the structured data:
Viewing logs
Gadget logs all events in your application. Logs are queryable using Lucene query syntax, a powerful language for searching through logs.
If your log viewer query bar is using the legacy LogQL format with an environment_id stream selector and the default | json |
level=~"info|warn|error" filters, your environment is still using the legacy LogQL query language. See Legacy: LogQL
syntax for documentation on that format. Gadget will migrate your environment to Lucene syntax automatically.
Gadget apps use structured logging. Logs are JSON objects that can contain a string message and key-value pairs of other data. console.log works like it might in the browser or Node.js in other JavaScript environments, but if you want to log structured data, you can use the structured logger object passed to your action files or request.log passed to HTTP routes.
The default log retention period is 30 days. If you would like to increase this, please reach out to support.
Querying for a string
To search your logs for a specific string, enter it as a search term:
"some string"
Gadget will return all logs containing this string over the searched time range. Search terms match against the log message, structured data keys and values, and trace IDs. Searches are case-insensitive. Error, error, and ERROR all return the same results.
Unquoted search terms match whole words only. For example, error matches logs containing the word "error" but not "errors" or "errorCode". To match partial words, use wildcards: err* matches any word starting with "err", and *err* matches any word containing "err". Quoted phrases like "connection refused" match the exact sequence of words. Whole-word searches are significantly faster than wildcard searches, so prefer error over *error* when possible.
Excluding a string
To exclude logs containing a specific string from your results, use the NOT operator:
NOT "some string"
Querying for key/value pairs
To search your logs for structured entries where a particular key has been set to a particular value, use field:"value" syntax:
someKey:"some value"
You can search for multiple keys and values simultaneously using the AND and OR operators.
someKey:"some value" OR someKey:"some other value" someKey:"some value" AND anotherKey:"some other value"
Querying for a particular trace_id
To search your logs for a specific trace_id, use the trace_id field. For more context, see Trace IDs.
trace_id:"abcde12345"
Gadget will return all logs tagged with this trace ID over the searched time range. If nothing is found, you may need to expand your time range further to find when a particular trace was executed.
Search fields
Gadget's log search supports several built-in fields that can be used to filter logs:
| Field | Description | Example |
|---|---|---|
level | Filter by log severity. Supports exact match or comparison operators. | level:"error", level:>=warn |
source | Filter by log source. Use "user" for your code or "platform" for Gadget platform logs. | source:"user" |
trace_id | Filter by trace ID to find all logs for a single request. | trace_id:"abcde12345" |
hostname | Filter by the hostname of the server that produced the log. | hostname:"my-pod-xyz" |
Any custom key you pass to the structured logger is also searchable as a field. For example, if you log logger.info({ orderId: "123" }, "order processed"), you can search for orderId:"123".
You can combine fields with boolean operators and parentheses for more complex queries:
error AND level:>=warn AND source:"user" (level:"info" OR level:"warn") AND source:"user"
By default, the log viewer filters to level:>=info. You can modify the search query, and if you need to restore the default, click the Reset button in the query bar.
Troubleshooting
Query consumed too many resources
If your search query spans a large time range or matches a very high volume of logs, you may see an error like:
Your log search query consumed too many resources. Try narrowing your time range or adding more specific filters.
To resolve this:
- Narrow the time range: Logs are partitioned by day, so keeping your query within a single day is the most effective way to reduce the amount of data scanned.
- Add a search term: Queries without a search term scan all logs in the time range. Even a broad term like
errorallows the search index to skip large chunks of data. - Add filters: Use field filters like
source:"user"orlevel:>=warnto reduce the volume of logs scanned. - Prefer
ANDoverOR:ANDnarrows the search and lets the index skip more data, whileORbroadens it. For example,error AND timeoutis faster thanerror OR timeout. - Combine
NOTwith positive terms:NOTon its own, such asNOT timeout, cannot use the search index and must scan all matching logs. Pair it with a positive term.error AND NOT timeoutis much faster becauseerrorcan use the index first. - Avoid wildcards when possible: Whole-word searches like
erroruse an optimized index and are significantly faster than wildcard searches like*error*, which must scan more data.
Invalid query syntax
If your search query has a syntax error such as unmatched quotes or invalid operators, the log viewer will display the parser error. Double-check that all quoted strings are properly closed and that boolean operators AND, OR, and NOT are uppercase.
Legacy: LogQL syntax
This section applies only to environments that have not yet been migrated to the new log viewer. If your query bar shows level:>=info syntax, you are already on the new Lucene-based log viewer and should use the documentation above.
Environments still using the legacy log viewer query logs with LogQL. All LogQL queries require a stream selector. Gadget includes the default prefix {environment_id="..."} | json | level=~"info|warn|error" for you. You can modify the stream selector, but you cannot omit it. Click the Reset button to restore the default.
Querying for a string with LogQL
Use the |= operator to search for a specific string:
{environment_id="{YOUR_ENVIRONMENT_ID}"} | json | level=~"info|warn|error" |= "some string"
Excluding a string with LogQL
Use the != operator to exclude a specific string:
{environment_id="{YOUR_ENVIRONMENT_ID}"} | json | level=~"info|warn|error" != "some string"
Querying for key/value pairs with LogQL
Since the default query already includes | json, you can append key/value filters directly:
{environment_id="{YOUR_ENVIRONMENT_ID}"} | json | level=~"info|warn|error" | someKey="some value"
You can combine multiple conditions with and and or:
{environment_id="{YOUR_ENVIRONMENT_ID}"} | json | level=~"info|warn|error" | someKey="some value" or someKey="some other value" {environment_id="{YOUR_ENVIRONMENT_ID}"} | json | level=~"info|warn|error" | someKey="some value" and anotherKey="some other value"
Querying for a trace_id with LogQL
{environment_id="{YOUR_ENVIRONMENT_ID}"} | json | level=~"info|warn|error" | trace_id="abcde12345"
Platform Logs
Gadget emits log entries as a platform in order to keep you informed about what work Gadget is conducting within your application. Gadget emits log entries for:
- Incoming requests and responses for HTTP routes
- Incoming requests and responses for GraphQL API requests
- Incoming webhooks for Connections including the Shopify connection
- Sync executions for the Shopify connection
- Shopify connection shop installation and uninstallation
Trace IDs
Gadget attaches a unique identifier to request called a trace ID. Every log emitted by any piece of code during that request will have the same trace ID marked on it, which allows you to find all the logs for one given request in your Logger.
Viewing all the logs for a single trace
To view the logs for one particular request through your application, and filter out all other requests, click the blue trace_id label in the logger for any log entry:
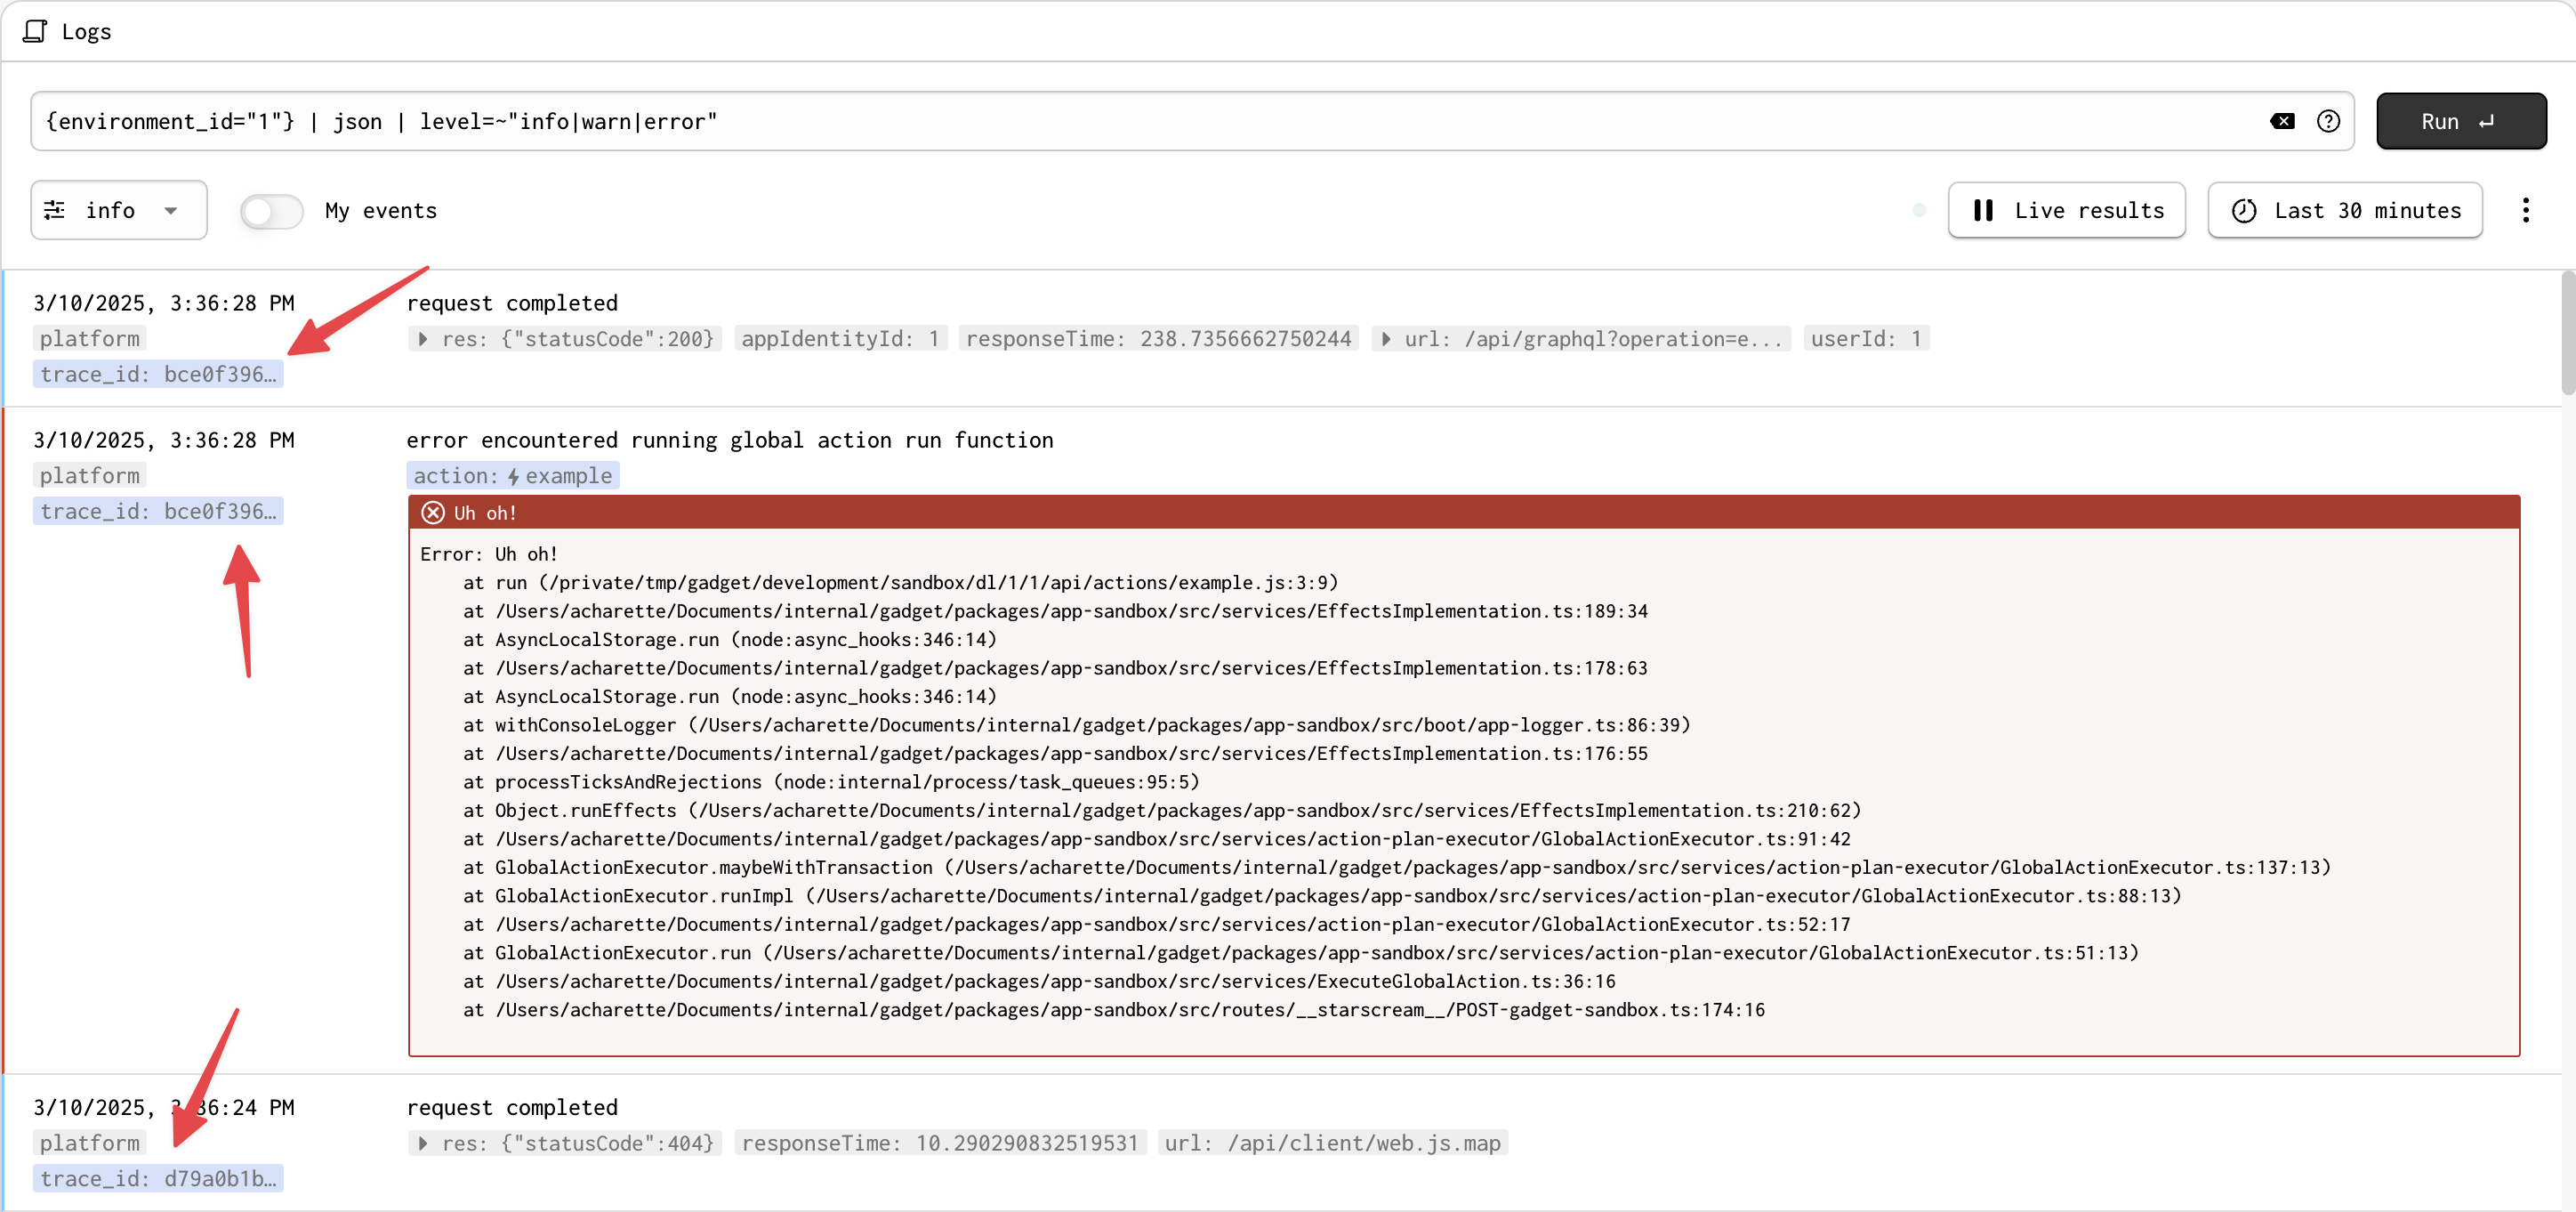
When you click a trace ID, the logger will adjust the log search query to filter out everything except logs for this particular trace. You can then add additional search terms to filter the logs further.
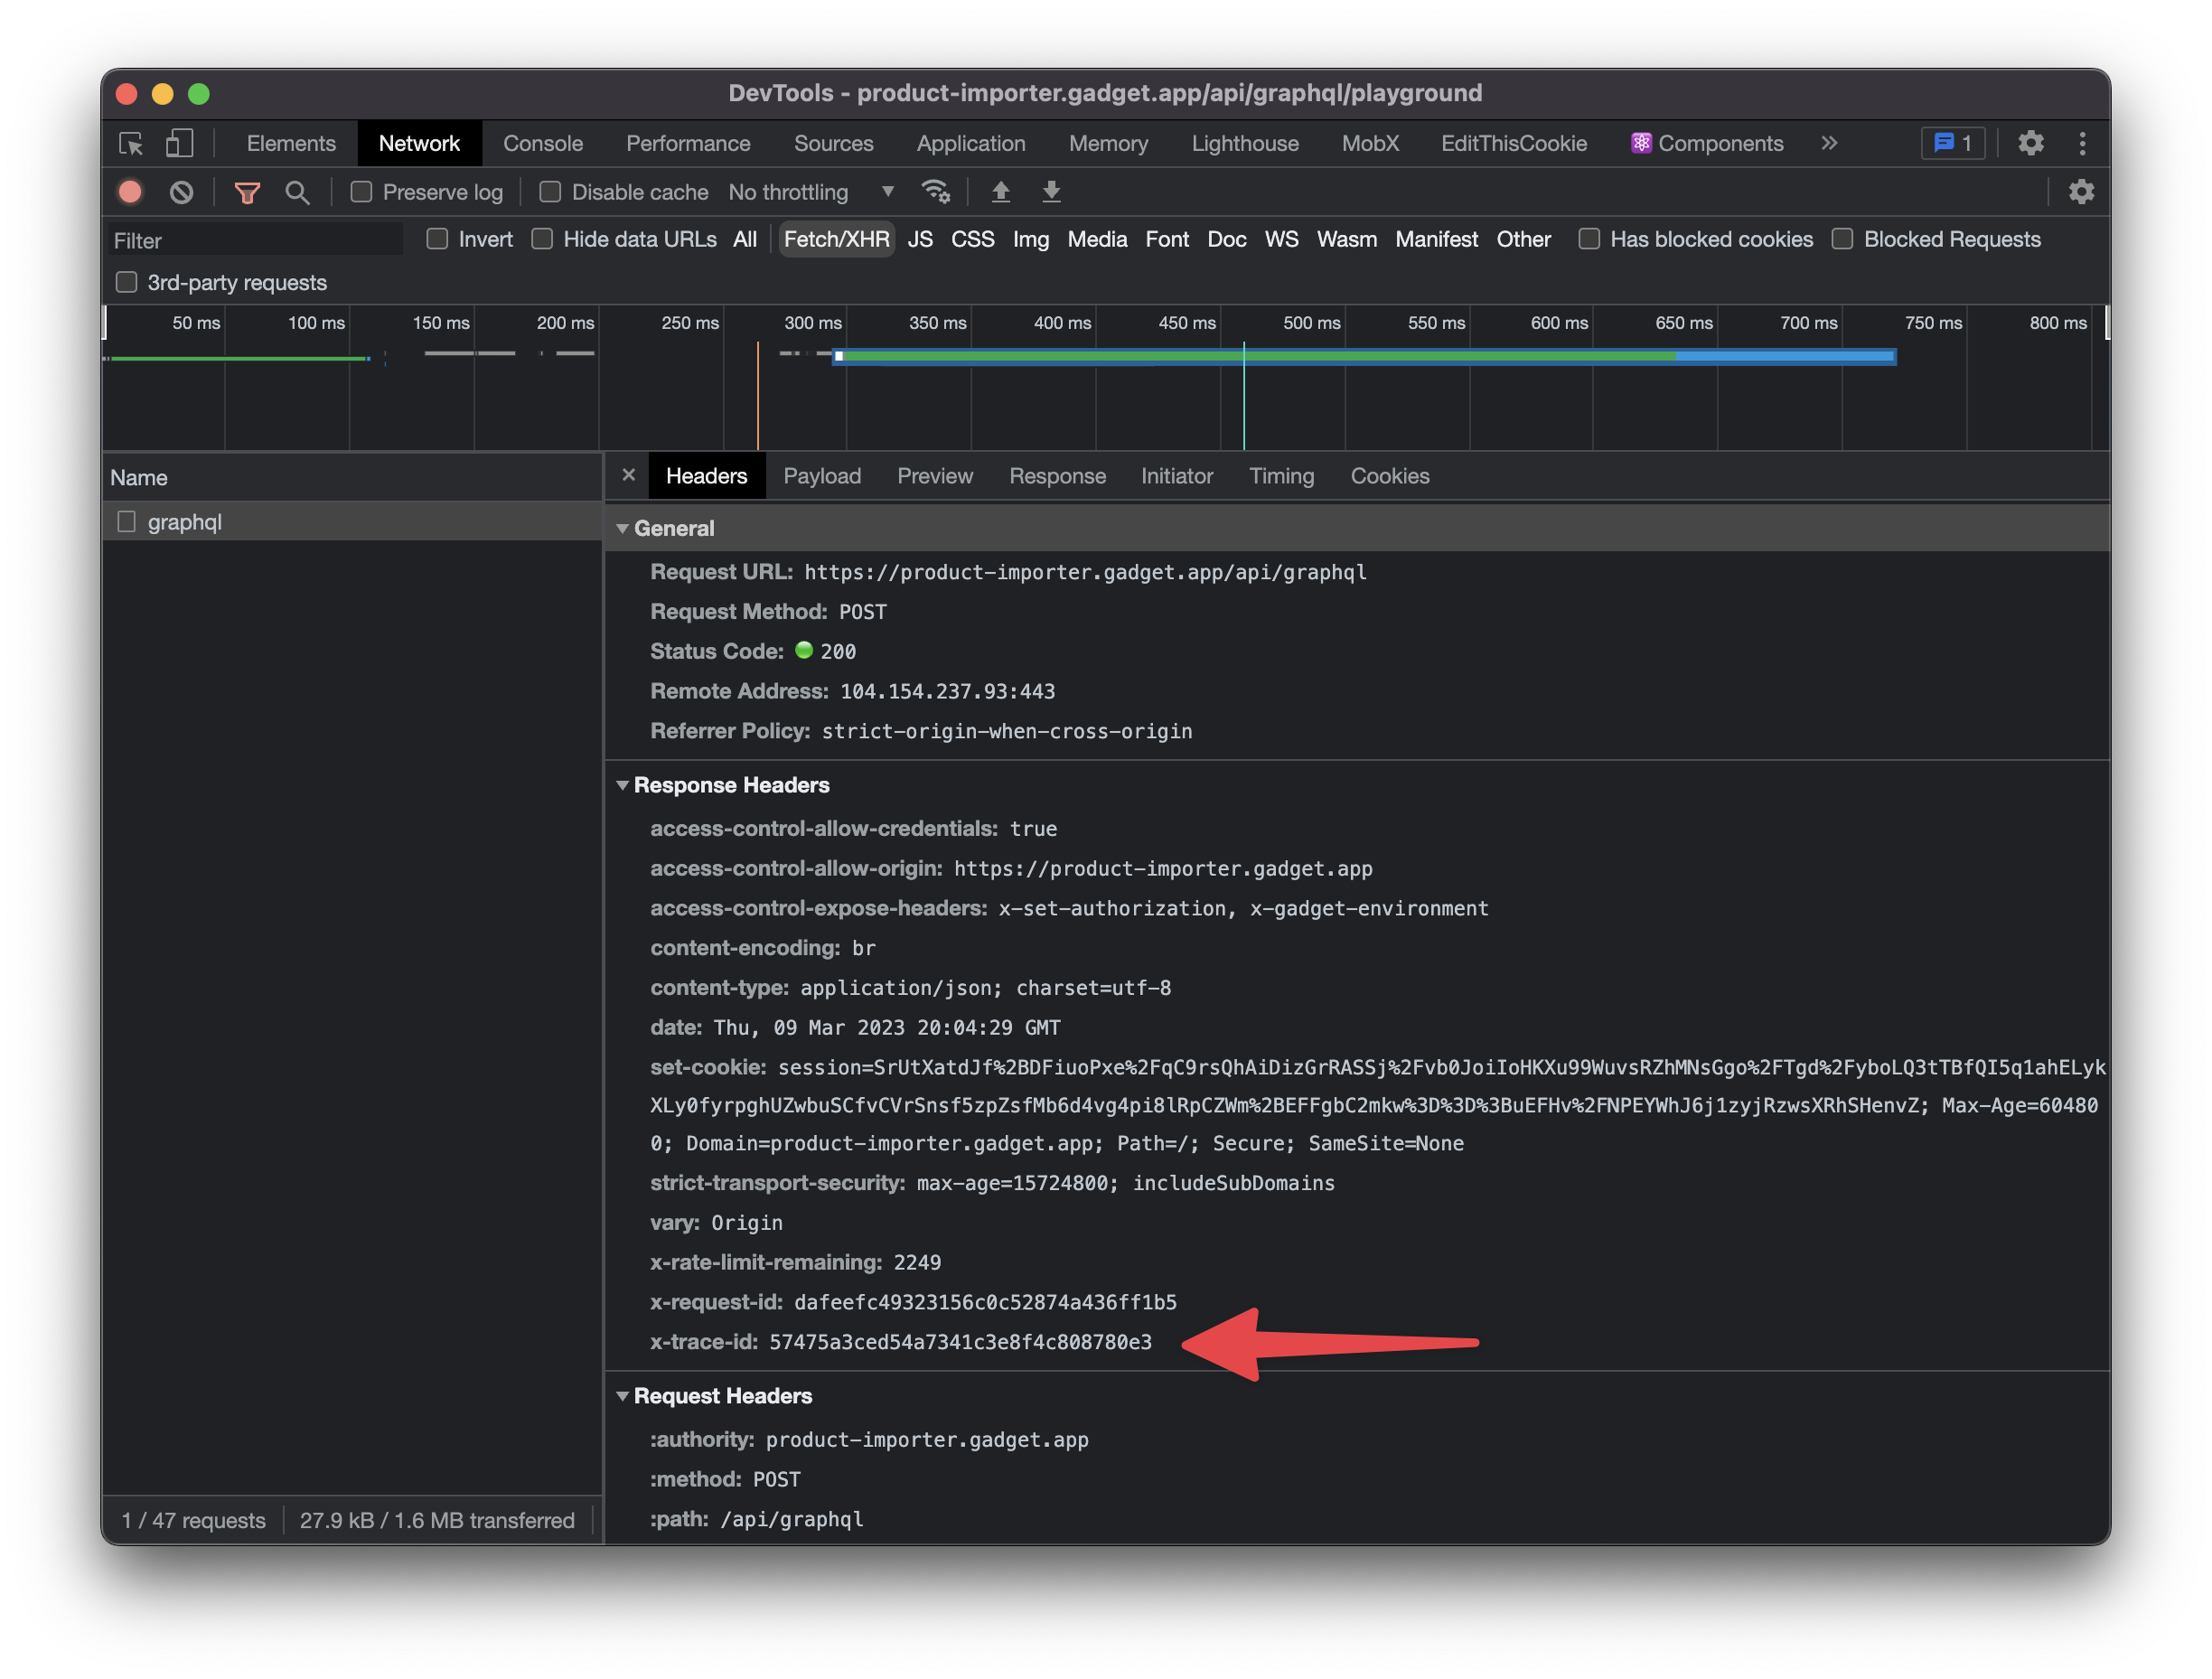
Getting the trace ID for a request
Gadget replies to each request with the trace ID in the x-trace-id header. If you use your browser's Developer Tools and look in the Network tab at a request made to the Gadget platform, you can find an x-trace-id response header showing the trace ID that Gadget assigned that request.
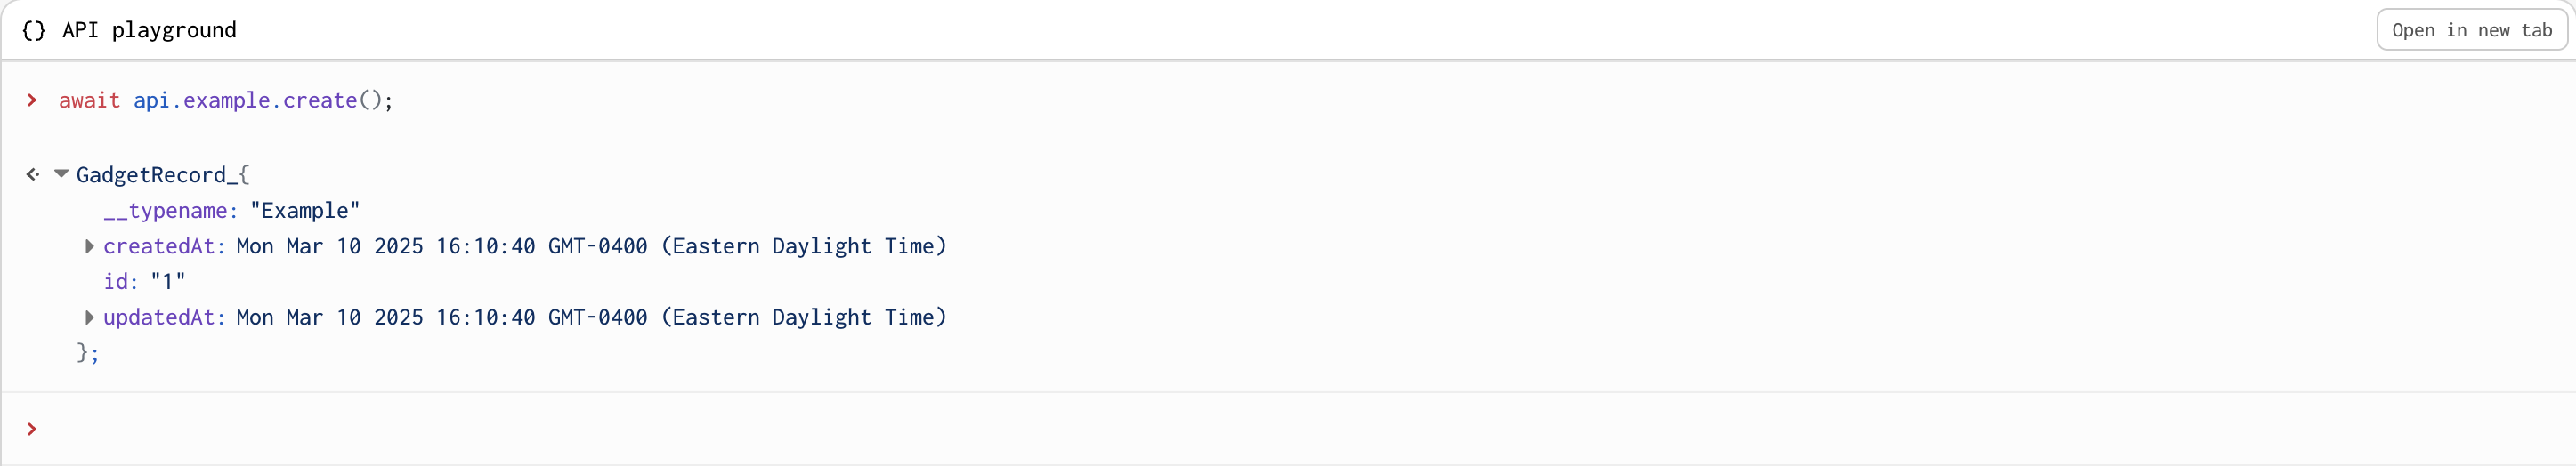
For requests to your app's GraphQL API, Gadget will also include an extensions property in the JSON response containing the trace_id for easy copy/pasting, as well as a direct link to the logs within your app for that trace. Requests made from any client will include this data, including your app's frontend and the Gadget GraphQL Playground. For example, this request made in the playground includes a link to the logger:
The trace ID and logs link are not sensitive data and are sent with every response. Only developers with access to your application's editor will be able to view the logs for a given trace ID.
Sending the trace ID as part of a response
If you want to include the trace ID in your response for debugging purposes or displaying it to the end user, you can access the traceId using the trace and context objects from the @opentelemetry/api package. Here's an example of how you might include the trace ID in a route's response: